StoryLocal news
New York's July Jobless Improvement Belongs to New York City Alone
New York City's jobless rate was 4.5 percent in July against 5.9 percent a year earlier, while none of the eleven metropolitan areas wholly inside the rest of the state improved at all, which leaves the statewide figure resting on one labor market.
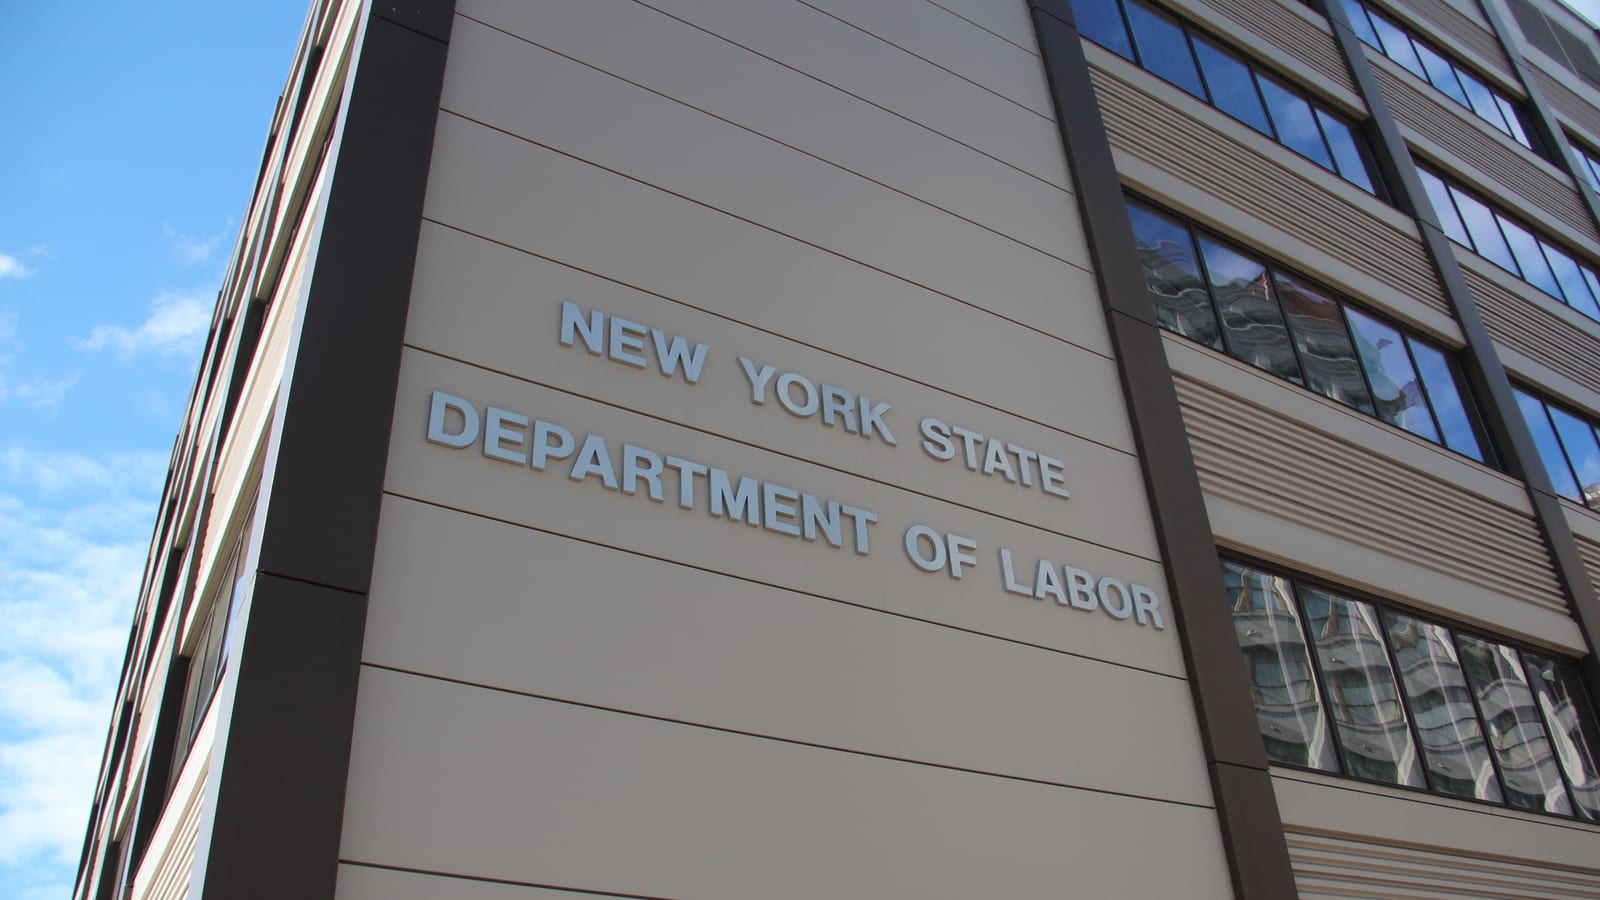
The July unemployment figures the Bureau of Labor Statistics issued on September 2, 2026 draw a line the statewide number hides. New York City's jobless rate was 4.5 percent in July, against 5.9 percent in July 2025, and the New York-Newark-Jersey City metropolitan area, which spans New York and New Jersey, fell to 4.3 percent from 5.4 percent over the same twelve months.
Those are the largest moves in the release. The Bureau recorded the biggest over-the-year payroll gain of any metropolitan area in the country in New York-Newark-Jersey City, 96,000 jobs, and among metropolitan divisions the New York-Jersey City-White Plains division was the only one in the United States to add jobs at all, 87,600 of them, a gain of 1.4 percent. Both of those areas take in New Jersey counties as well as New York ones, so neither figure is a New York total.
Not one of the other eleven improved
Eleven metropolitan areas lie wholly inside New York State and outside the New York City metro. In July not one of them had a lower unemployment rate than a year earlier. Eight were higher and three were level.
The four largest are the ones most readers will recognise, and they moved together. Buffalo-Cheektowaga was 4.4 percent against 4.3 percent a year earlier, Rochester 4.2 against 4.0, Syracuse 4.1 against 3.9, and Albany-Schenectady-Troy 3.7 against 3.6. Two tenths is the widest gap in that group, which is small in itself; what makes it worth stating is that all four moved the same way in a month when the city moved 1.4 points the other way.
The smaller markets tell the same story with no exceptions. Glens Falls was 3.4 percent against 3.2 percent, the largest year-over-year increase of any metropolitan area inside the state. Kingston was 4.0 against 3.9, Ithaca 4.2 against 4.1, and Utica-Rome 4.2 against 4.1. Binghamton at 4.3 percent, Elmira at 4.0 and Watertown-Fort Drum at 4.2 were each exactly where they had been in July 2025. Long Island's metropolitan division, Nassau and Suffolk counties, sits outside that group of eleven because it belongs to the New York City metro, and it was fractionally higher too, at 3.8 percent against 3.7 percent.
What the city was recovering from
The size of the city's improvement is partly a fact about the base it is measured from. New York City's rate, which is not seasonally adjusted, ran between 4.6 and 4.8 percent through the first five months of 2025, then climbed sharply: 5.2 percent in June 2025, 5.9 percent in July, and 6.0 percent in August, the peak of that run. It came down slowly from there, to 5.4 percent by December, then went back up to 5.5 percent in January 2026 and 6.0 percent again in February.
March through June 2026 ran 4.9, 4.8, 4.8 and 5.2 percent. Against that run, July's 4.5 percent is the lowest reading anywhere in the city series back to January 2025. The year-over-year comparison in the release is therefore measuring from the start of a climb rather than from a normal month, and both things are true at once: the July gap is genuinely the largest in the release, and it is flattered by where the comparison starts.
The payroll series says it twice
New York State added 64,500 nonfarm jobs over the year to July 2026, reaching 10,052,100, a gain of 0.65 percent. That is the state total, and it is dominated by one place. The New York-Jersey City-White Plains division, the part of the metro that contains the five boroughs, added 87,600 by itself. Because that division includes New Jersey counties, the two figures cannot be subtracted from each other, but the direction is not in doubt: the four largest upstate labor markets came close to cancelling each other out. Buffalo-Cheektowaga and Albany-Schenectady-Troy together added 4,400 jobs over the year, while Rochester and Syracuse together shed 4,500.
The month-to-month figures, which are not seasonally adjusted and so carry the summer hiring cycle inside them, point the same way. Between June and July 2026 New York State shed 20,200 nonfarm jobs. Buffalo-Cheektowaga lost 8,600, Rochester 10,400, Albany-Schenectady-Troy 6,200 and Syracuse 3,700. Over the same month the New York-Jersey City-White Plains division added 5,700. Every upstate market in the set went down in July and the city division went up.
What these numbers measure, and what they do not
Three different measurements are in play here and they are not interchangeable. The statewide rate is seasonally adjusted and comes from a model of the state as a whole: 4.4 percent in July 2026, preliminary, down from 4.6 percent in June and the same as July 2025. The metropolitan and city rates are not seasonally adjusted, which is why a July reading anywhere can move a tenth or two on nothing more than when summer hiring landed. And the national rate quoted alongside a state figure is usually the seasonally adjusted 4.1 percent for July, which comes from the household survey and measures the country; the national figure on the same basis as the metro numbers, not seasonally adjusted, was 4.4 percent in July 2026 against 4.6 percent a year earlier.
The state series is worth one more sentence. It printed 4.6 percent for nine consecutive published months, from September 2025 through June 2026, before the July reading of 4.4. That is the first break in a flat line that lasted most of a year, and it is preliminary.
Two gaps in the record are worth knowing about because they affect what can be compared. October 2025 is missing from every one of these series, state, city, metro and national alike; the Bureau's own footnote says the data are unavailable due to the 2025 lapse in appropriations. And the January 2026 national estimates were revised to incorporate updated population controls, which is a routine annual change and a reason to be careful about reading a single month across that boundary.
The case against reading much into one month
Every July metropolitan figure here is preliminary and none is seasonally adjusted, so the whole comparison is one revision away from looking different. The statewide 4.4 percent is preliminary as well. The upstate gaps are one and two tenths, which is inside the range a seasonal quirk can produce, and three of the eleven areas did not move at all. A reader who wanted to argue that nothing has diverged and that the city simply had a bad 2025 could point at all of that and would not be wrong about any of it.
What survives those deductions is the direction rather than the size. The city improved by more than a point against its own year-ago figure, eleven metropolitan areas inside the state improved by nothing at all, and the payroll counts move the same way in both the annual and the monthly comparison. That is a geographic split rather than a cyclical one, and it is the thing the single statewide number cannot show. New York's economic questions are collected on the money page.
What is next, and when
Two fixed dates follow. The Bureau publishes August state employment and unemployment on September 18, 2026, which is when the preliminary 4.4 percent either holds or is restated. August metropolitan figures follow on September 30, 2026, the next reading that can show whether the rest of New York starts to move with the city or holds where it is.
Questions readers are asking
Did unemployment fall across New York in July?
No. New York City was at 4.5 percent against 5.9 percent a year earlier, while of the eleven metropolitan areas wholly inside the rest of the state not one improved: eight were higher and three were level.
Which New York metro area had the biggest rise in unemployment?
Glens Falls, at 3.4 percent in July 2026 against 3.2 percent in July 2025. That is the largest year-over-year increase of any metropolitan area lying wholly inside New York State.
Why is the New York-Newark-Jersey City figure not a New York number?
Because that metropolitan area takes in New Jersey counties as well as New York ones, as does the New York-Jersey City-White Plains division that added 87,600 jobs. Neither total belongs to New York alone.
How firm are the July metropolitan figures?
They are preliminary and not seasonally adjusted, so where the summer hiring cycle fell can move a rate by a tenth or two. The statewide 4.4 percent for July is preliminary as well.
When is the next reading?
The Bureau of Labor Statistics publishes August state employment and unemployment on September 18, 2026, and August metropolitan figures on September 30, 2026.
Sources 5 · as the story cites them
- Bureau of Labor Statistics, New York State unemployment rate (LASST360000000000003) — data.bls.gov · primary ·
- Bureau of Labor Statistics, New York State total nonfarm employment (SMS36000000000000001) — data.bls.gov · primary ·
- BLS, Metropolitan Area Employment and Unemployment (Monthly), July 2026, issued September 2, 2026 — bls.gov · primary ·
- BLS, Metropolitan Area Employment and Unemployment release schedule 2026 — bls.gov · primary ·
- BLS, State Employment and Unemployment release schedule 2026 — bls.gov · primary ·